GOLDEN RATIO (Horizontal Line Analysis)
Fibonacci numbers (sometimes called Golden numbers) was discovered by a mathematician called Leonardo Fibonacci. The Golden numbers are a sequence of numbers in which each successive number equals the sum of the two previous numbers: 0, 1, 1, 2, 3, 5, 8, 13, 21, 34, 55, 89, 144, 610, 754, etc.
After sequences of calculations, there are constant relationships that can be observed from the series. For example, if you divide the former number by the latter, the approximate value of them comes up with 0.618:
21/34 = 0.617647 ~ 0.618
34/55 = 0.618181 ~ 0.61855/89 = 0.617977 ~ 0.618
89/144 = 0.618055 ~ 0.618
Furthermore, dividing the latter number by the former number gives another relationship from the sequence. The outcome yields approximately 1.618:
55/34 = 1.617647 ~ 1.618
89/55 = 1.618181 ~ 1.618144/89 = 1.617977 ~ 1.618
With the use of these magic numbers, a series of horizontal lines can drawn at the Fibonacci levels of 0.0%, 23.6%, 38.2%, 50%, 61.8%, 100%, 161.8%, 261.8%, and 423.6%. In practice, it is more understandable and simple to draw within the range from 0% to 100% (e.g. 0%, 38.2%, 50%, 61.8% and 100%) for analyzing the trend of different stocks/sector indexes/market indexes/forex markets.
Nowadays, investors tend to have consensus that these magic numbers become their useful trading tools in finding the important support and resistance levels. The following examples show some of the typical practice of using golden ratio in the stock market.

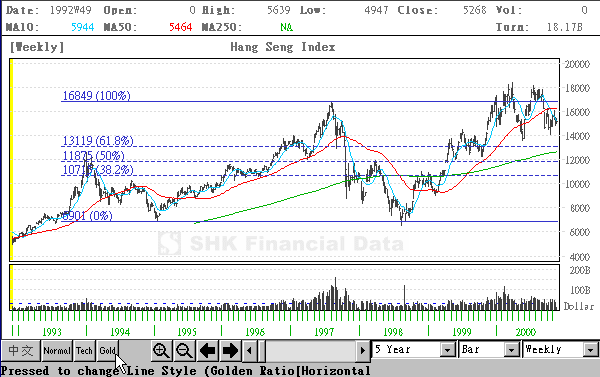
As shown from the above Hang Seng Index (HSI) Chart, we had positioned the bottom found (around 6,900pts) in Jan 95 as the starting point and assumed that the HSI peaked in Aug 97 (around 16,800pts).
It could be observed that when the HSI peaked in Aug 97, it quickly retraced back to the 61.8% level of around 13,000pts (i.e. 6,900pts plus 61.8% of the total increased portion from 6,900pts to 16,800pts). Afterwards, HSI rebounded to around 15,000pts, which regained nearly 50% of the previous declined range of (16,800pts - 13,000pts). However, when HSI could not find its support in around 13,000pts, it further fell to find its support near the fibonacci levels, say 50% level and 38.2%. As observed from the above Chart, HSI moved around the 38.2% and 50% retracement levels for several months. However, the extremely negative market sentiment push the HSI further down to the starting point (i.e. around the level of 6,500pts to 7,000pts) in Aug 98.
In the second quarter of 1999, a Head-and-Shoulder bottom was established and the negative market sentiment started to reverse. An attempt was then made to break through the resistance levels (i.e. the previous support levels at around 11,000pts to 12,000pts). This trading pattern both confirmed the coming of the bull market and the magic explaining power of the golden ratio.

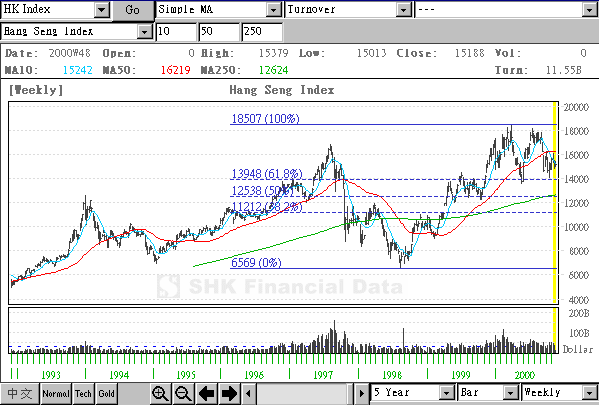
In our Java Charting System, you can easily use our interactive ruler, which is embedded with the function of automatically calculating appropriate support and resistance levels using the golden ratio.
You can use this powerful ruler with the following steps:
As shown from the above Chart, after plotting the starting point of the HSI at around 6,500pts and the finish point at around 18,500pts, the ruler can clearly show you that the retracement support level should be around 14,000pts (61.8% level) and 12,500pts (50% level).